What is UTCI?
The Universal Thermal Climate Index, UTCI, is a bioclimatic index for describing the physiological comfort of the human body under specific meteorological conditions (Bröde et al. 2012). It takes into account not just the ambient temperature but also other variables like humidity, wind and radiation, all factors significantly affecting our physiological reaction to the surrounding environment.
For example, imagine it is 0°C outside but on a very sunny day. The real temperature is 0°C, but you may easily feel it is like 12°C under the intense sun. On the contrary, imagine now that suddenly a big, dense and dark cloud covers the sun and some intense wind starts to blow. It is still 0°C but you may feel it’s now like -10°C. This estimation of our physiological reaction to the external conditions is what UTCI measures and, as you can see, the difference with the standard measurement of the air temperature can be notable.
Thermal stress is divided into 10 UTCI stress categories ranging from extreme heat stress (above +46°C) to extreme cold stress (below -40°C).
UTCI is based on the UTCI-Fiala model (Fiala et al., 2012), which combines a dynamic thermoregulation model of the human body together with a temperature-varying clothing insulation model, both describing distinct states depending on different ambient factors. Altogether, UTCI provides an estimation of the “apparent” temperature that our body would feel under a given environmental condition specified by the air temperature, wind, humidity and radiation. This apparent temperature is in reality the temperature that a reference environment, defined by fixed values of humidity, wind and radiation, should have in order to produce in our body the same physiological reaction of the one produced by the initial given environment.
Why is UTCI important?
UTCI considers more variables that influence thermal comfort, besides temperature. For this reason, is it a more accurate indicator to use when analyzing the impacts that the environment conditions have on the human body and on people’s behaviour. Among the many potential applications, UTCI can be useful, for example, to investigate impacts on health, on energy consumption or even on human migration due to extreme climate.
It is essential to have in mind that UTCI does not have to match the physical measurements of air temperature that are commonly used in climate science. Human beings do actually react to UTCI values and not strictly to the values that thermometers display, being this one only a proxy of our physiological comfort which, in reality, includes other meteorological variables.
As UTCI provides a more realistic picture of the thermal stress perceived by the human body, understanding its historical evolution and future changes is of paramount importance to develop on time effective and efficient adaptation and mitigation policies and action plans to alleviate its consequences but also to reduce counter-effects derived by human behaviour in response to it through the implementation of carbon neutral solutions.
Does the air temperature differ a lot from the UTCI values?
Usually yes. As explained before, UTCI provides a human-based representation of the environment temperature. But how much does UTCI differ from the standard physical measurement of the air temperature?
Let’s look at this for one specific location on Earth. The figure below shows how monthly averages for the maximum daily values of both variables, air temperature and UTCI, change along the year in Barcelona (Spain).
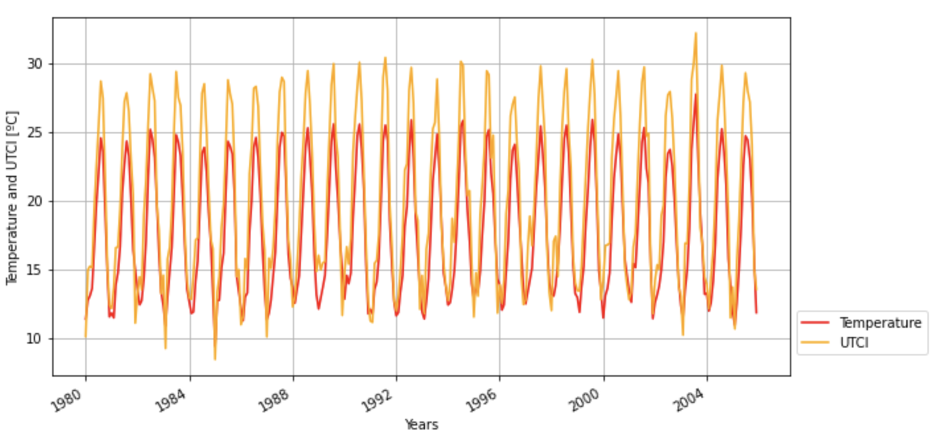
You can clearly distinguish the repetition of the seasonal cycle along the years, with minimum values in winter and maximums in summer. Note that these are monthly averages, while daily maximum temperatures vary clearly beyond these ranges. Due to the very humid environment caused in Barcelona by the nearby Mediterranean Sea, air temperature (red line) reaches values in summer of 25°C while UTCI (yellow line) is close to 30°C.
These several degrees difference between the temperature measured by the thermometer and the one felt by our body is however not constant. As you can see, this difference is minimal during the winter season. In this case this is due to the effect of humidity at intermediate temperatures that is not that critical for the auto-thermoregulation of our physiological system.
But what happens in a colder location? Let’s now go to London (UK) and look again at the monthly average of the daily maximum values. The figure below shows again the seasonal cycle along the years but with much lower values for both variables.
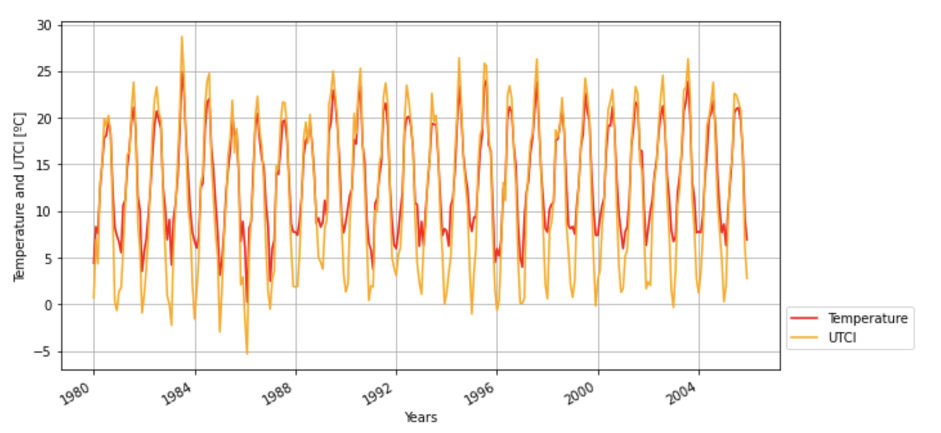
Contrary to what happens in Barcelona, during summer in London, daily maximum air temperatures are on average similar to daily maximum UTCI values. However during winter months, there is a significant difference between the two and our perception of the cold ambient (represented by UTCI) can easily be more than 10 degrees below the thermometer temperature. The stormy weather (windy, cloudy and wetty) that characterizes the British climate seems to be the explanation of this notable difference.
These two specific examples clearly illustrate how UTCI represents temperature distinctly from physical measurements in different locations and at different moments of the year.
But what is the general pattern at global scale?
Let’s have a look at the map below. The map shows a wildly general pattern of the differences between the annual averages of the daily maximum values of UTCI and air temperature all around the Earth.
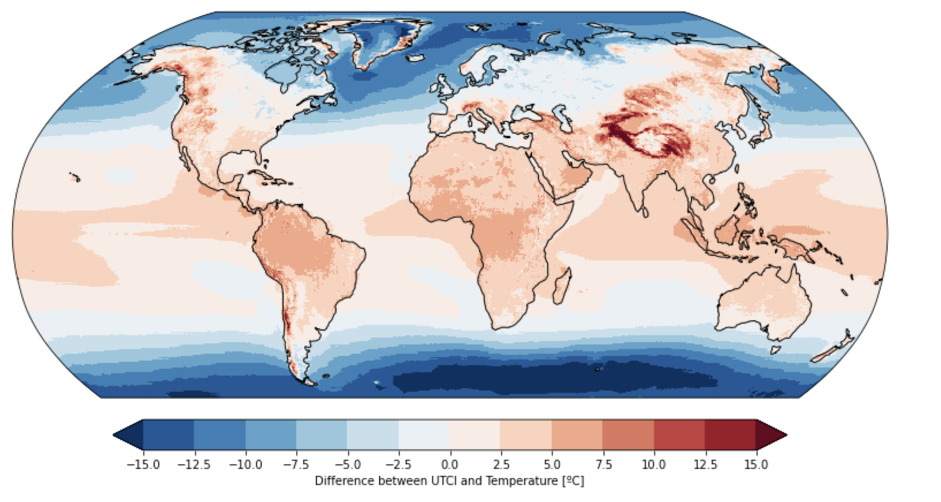
It appears that, in general, in a large part of the Globe, from the tropics to the temperate climates, UTCI shows higher values. This means that our physiological system reacts to the thermal conditions as if it would be warmer than the actual and measured air temperature (as we have seen in Barcelona). A general explanation to this is the combination of an intense solar radiation together with a humid air. On the contrary, at higher latitudes, UTCI presents much colder values, due to weak solar radiation (or even lack of solar radiation at the Arctic regions) but also likely due to stronger and more frequent storms (i.e. windier and cloudier days) as we have seen in London.
In summary, UTCI appears as a key bioclimatic indicator for understanding the impacts of the climate on human activities.
UTCI data
The Copernicus Climate Change Service (C3S) provides consistent information about the climate anywhere in the world so that users can look at the past and make informed decisions for the future. Its main mission is to provide free access to quality-assured, traceable data and applications. This means anyone can delve into the wealth of information provided in its Climate Data Store, which is a one-stop-shop for anyone looking for climate data. As part of the European Union’s flagship Earth observation programme, C3S takes observations from satellites as well as sensors on the ground, in the oceans and in the air (known as ‘in-situ’) to provide climate data. By supporting policymakers and public organisations, businesses and citizens, C3S helps them to deal with the consequences of climate change and prepare for the future through mitigation and adaptation.
Past and present
The C3S Climate Data Store currently provides a global historical record of UTCI fields through the ERA5-HEAT dataset (DiNapoli et al. 2020b). UTCI values are directly computed from the ERA5 reanalysis fields of air temperature, wind, humidity and radiation providing an hourly temporal resolution in a 0.25° grid coveraging from 60°S to 90°N.
Future
Future fields of UTCI have been computed by Lobelia from CMIP5 climate projections of the required variables available in the C3S Climate Data Store. In order to compute daily maximum and minimum values of UTCI with the available data, the following approach has been implemented: Daily mean humidity, daily mean wind and daily maximum and minimum temperatures have been used from the CMIP5 daily data on single levels dataset (1971-2100). The solar and thermal radiative components of the UTCI are combined and represented in one single variable, the mean radiant temperature (MRT) before computing UTCI fields (DiNapoli et al. 2020a). The large diurnal variability of the MRT requires hourly resolution fields which are not available on the CDS for climate projections. For this reason, climatological monthly means of daily maximum and minimum MRT have been used instead, directly computed from the hourly ERA5-HEAT dataset. A validation of this approach have been carefully performed showing that the corresponding error is well below the inner uncertainty of the official UTCI dataset tending to zero when monthly averaging. Currently, UTCI projections are calculated for the RCP8.5 scenario using the ACCESS1-0 model after being bias corrected.
About climate projections
Climate projections are numerical simulations of the Earth’s climate system typically extending up to year 2100 and based under different possible assumptions of greenhouse gases and aerosols concentrations. Analogously to common weather forecasts that aim to predict the exact weather for a given day, climate projections aim to provide the main features that characterize the climate system during a temporal period between 20 to 30 years. This means that climate projections do not pretend to predict, for example, the average air temperature on a given location for a specific month of a specific year. Instead, they provide an estimation of the ranges of values that the air temperature will have on average for a specific month in a certain area within the selected temporal period.
In our UTCI projections, we show UTCI values that are the expected average for a whole period of 20 years. Therefore, we provide projections for the following future temporal periods: from 2021 to 2040, from 2041 to 2060, from 2061 to 2080 and from 2081 to 2100. These periods are respectively identified with the corresponding middle decade as 2030, 2050, 2070 and 2090. We have additionally included the shorter period that goes from 2005 to 2020, identified as 2010, to provide some hints of the most recent past climate period. Note that we cannot go before 2005 since the CMIP5 projections used in this analysis start in 2005.
The use of UTCI data:
UTCI data is more accurate than just temperature to better assess the potential impacts on human health and behaviour. In fact it uses the UTCI-Fiala model (Fiala et al.2012), an energy-balance model able to replicate the human body’s ability of thermoregulation in relation to external factors. It also includes a temperature-adaptive clothing model which considers how the general urban population adapts with clothing insulation in response to environmental temperature. Moreover, UTCI data include radiation and wind components, beside temperature. These factors play an important role in alleviating or increasing the final temperature perceived by the human body. As all the mentioned aspects highly affect the temperature perceived by the human body and its ability to maintain its core temperature within certain boundaries in respect to external factors, they are therefore important to consider when investigating the effect of thermal stress on human health and people behaviour, making UTCI more accurate compared to the indexes considering only the temperature itself.
Health impacts related to thermal stress
Thermal stress has important consequences on the human body. Relevant and even mortal effects can derive from both heat and cold stress.
Heat stress
Health impacts related to heat stress include heat-related disorders such as dehydration and sunstroke, and excess morbidity and mortality in affected areas due to cardiovascular and respiratory diseases (Semenza et al. 1996; Curriero et al. 2002).
The relationship between the UTCI and death counts depends on the bioclimate of the country, and death counts increase in conditions of moderate and strong stress, when UTCI is above 26 and 32°C. The UTCI’s ability to represent mortality patterns was demonstrated for the 2003 European heatwave in this study.
Cold stress
Among the major consequences of cold stress frostbite, a tissue injury resulting from tissue cooling and subsequent freezing, and hypothermia are the most common. Hypothermia is a dangerous condition that occurs when the body loses heat faster than it can replace it and it is unable to maintain the internal body temperature of 36 degrees. If prolonged it can lead to loss of consciousness and death. Other impacts of cold stress include increase in respiratory, cardiovascular and circulatory risks, as well as adverse effects on concentration and memory (Holmér et al. 2012).